Bath Local Economy: A Guide to the Numbers and Their Boundaries
How to distinguish Bath from the wider district, business sites from enterprises, and historical figures from newer economic indicators.
Published
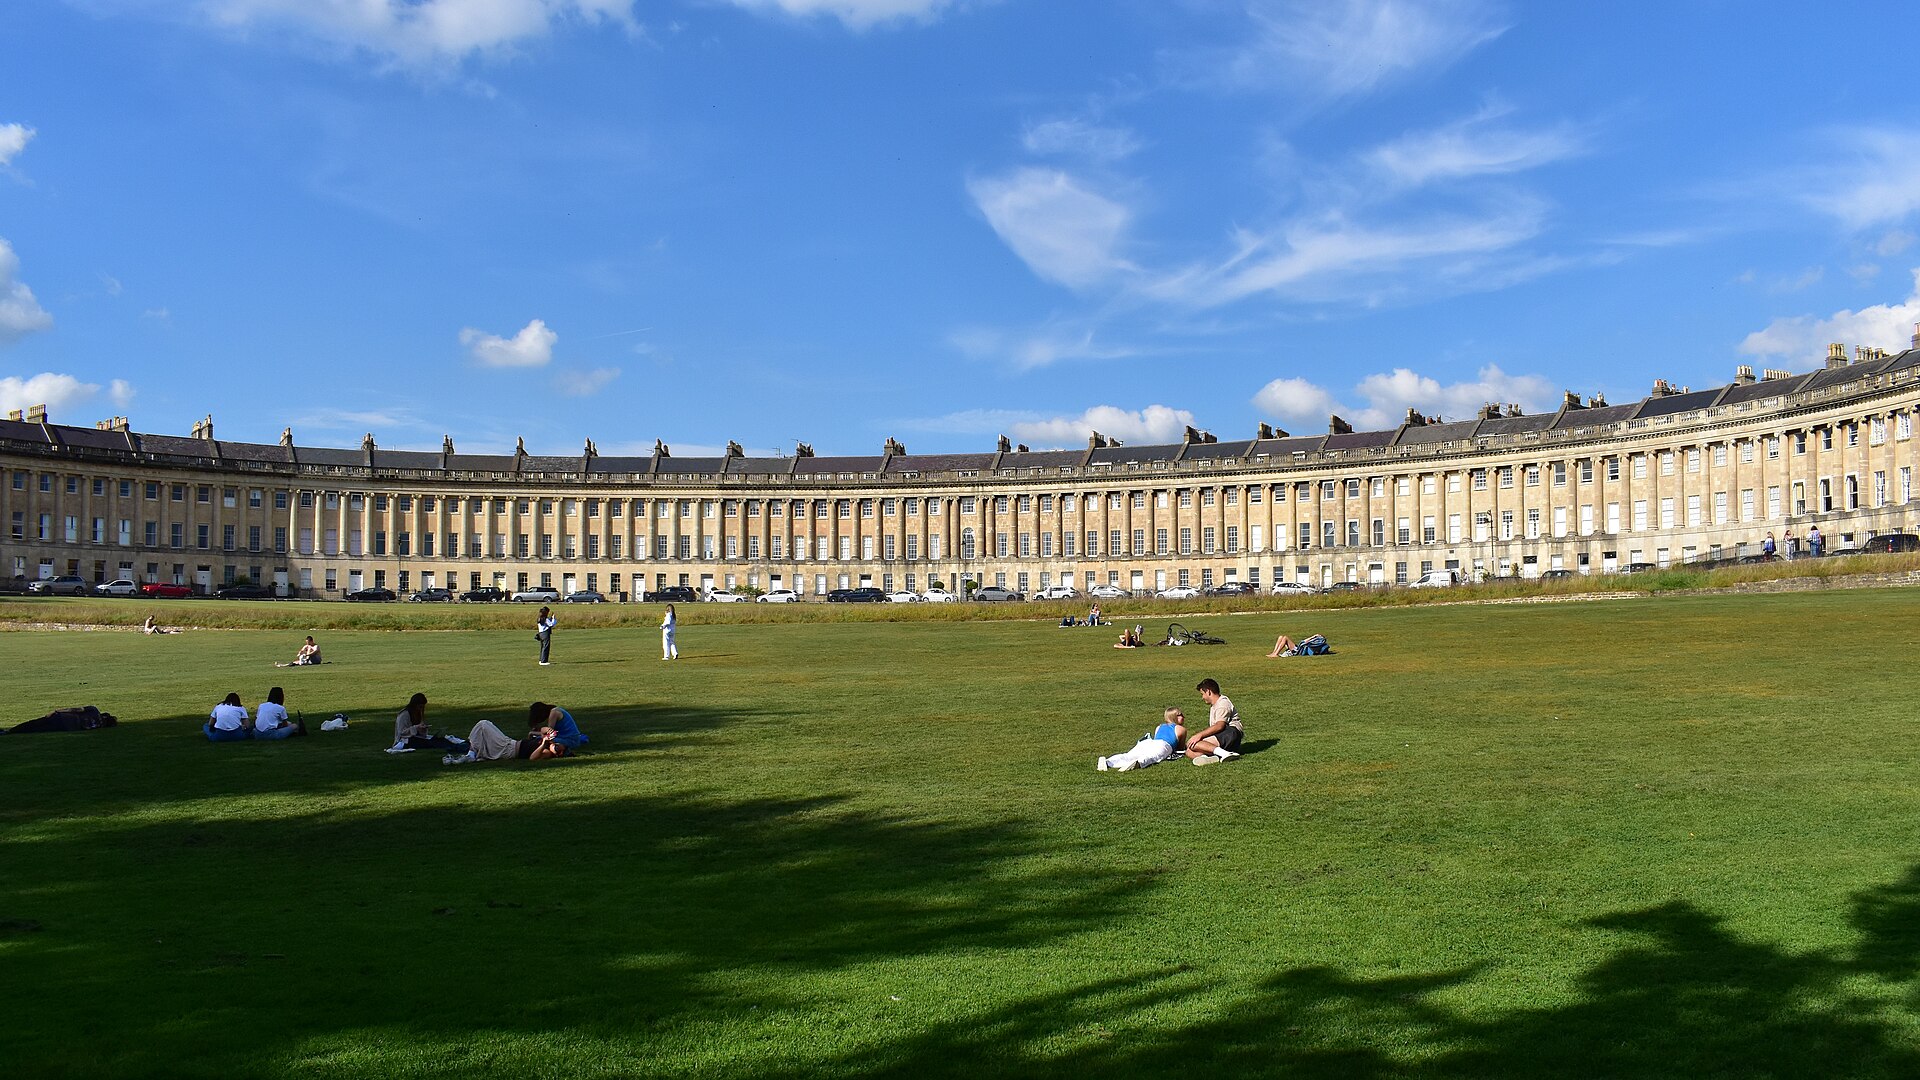

Figures about the Bath local economy need a boundary attached. Bath and North East Somerset, usually shortened to B&NES, includes several areas that the council’s economic evidence treats separately. In its analysis of 2020 business sites, the Bath City sub area accounted for 53% of the district total. Using that district total as a figure for Bath would change the story before any comparison began.[1]
Bath City and B&NES Measure Different Areas
The Economic Strategy Evidence Base, prepared for Bath and North East Somerset Council, divides its business distribution analysis into Bath City, Keynsham, Rural Area and Somer Valley. These are defined sub areas used for that analysis. A number labelled B&NES covers the wider district, while a Bath City figure refers to one part of it.[1]
That distinction matters when you’re assessing a business location. A district business count describes a wider market than a Bath City count. Even the Bath City label needs care: the report identifies a defined sub area, so it should retain that name when quoted. Relabelling it as the city centre would introduce a different boundary.[1]
For a business plan or presentation, put the geography beside the figure rather than leaving it in a footnote. “B&NES business sites” and “Bath City sub area business sites” tell readers which area the number describes. Neither label establishes how many potential customers are within reach of a particular shop or office.[1]
An Enterprise and a Business Site Are Different Units
The evidence base calls the sites in its sub area analysis “local units”. It uses the Office for National Statistics definition of these as individual sites belonging to an enterprise. The distinction is between the organisation and its individual locations.[1]
For questions about where business sites are distributed, local units are the relevant measure in this report. If an enterprise operates from several sites, counting those sites can produce a different total from counting the enterprise once. Check the unit before comparing two business totals, even when their geography and year match.[1]
A Share of Growth Is Different From a Growth Rate
Figure 2.2 provides a useful example. The Bath City sub area held 53% of B&NES local units in 2020, but accounted for 46% of the district’s business change over 2011–2020. The first percentage describes the distribution at the end of the period. The second describes how the district’s change was distributed.[1]
Reading that second figure as “Bath businesses grew by 46%” would give it the wrong denominator. To calculate a Bath City growth rate, you would need its own starting count and change over the same period. The share-of-change figure answers a narrower question: how much of the district’s recorded change belonged to that sub area?[1]
Keep the observation period visible, too. These are 2020 distribution figures and a 2011–2020 comparison. They provide historical context for the district’s business geography. Quoting them today doesn’t make them a measurement of today’s economy.[1]
Employment, Pay and Claimants Answer Separate Questions
The council’s Business & Skills Plan Annual Report 2025 groups an employment rate, median weekly pay and a claimant count under its employment and wages discussion. Keep those measures separate when using the report. A percentage, a weekly pay amount and a count of people cannot serve as substitutes for one another.[2]
Before comparing a pay figure with another area, check that both use the same worker coverage, residence or workplace basis, and observation period. Preserve “median weekly pay” as the measure’s name. Likewise, before using an employment rate to discuss recruitment, establish whose employment it measures rather than assuming it counts jobs located in Bath.[2]
There’s also a limit to what a district headline can say about individual communities. The 2025 annual report identifies persistent skills gaps and barriers affecting young people from lower-income backgrounds. If your decision concerns recruitment or training, ask for evidence about the people and area you intend to reach alongside the district figure.[2]
Sources and checks
These sources were used for this article. Availability, prices and service details can change after the stated check date.
- https://www.bathnes.gov.uk/sites/default/files/BNES%20Economic%20Strategy%20Evidence%20Base%20v4_0%20WMA%20Accesibility%20Amend%20%281%29.pdf
Checked 20 October 2026.
The report distinguishes Bath City, Keynsham, Rural Area and Somer Valley as sub areas within B&NES. The report defines local units as individual sites belonging to an enterprise. The Bath City sub area accounted for 53% of B&NES local units in 2020. The Bath City sub area accounted for 46% of B&NES business change over 2011–2020. Figure 2.2 distinguishes the share of business sites from the share of district business change. The article’s explanation of different denominators follows from these two measures. These observations concern 2020 and 2011–2020, rather than the present economy.
- https://www.bathnes.gov.uk/sites/default/files/Business_and_Skills_Plan_Annual_Report_July_2025.pdf
Checked 20 October 2026.
The annual report presents employment rate, median weekly pay and claimant count as separate indicators for B&NES. The pay measure is labelled median weekly pay. The article recommends checking population coverage, geography and observation period before comparing these indicators. The report identifies persistent skills gaps and low qualification levels in more deprived communities. The report identifies barriers to skills affecting young people from lower-income backgrounds, including transport and digital skills. The report’s discussion of unequal outcomes supports seeking more specific evidence for targeted recruitment or training decisions.